GeoGrid
How to Read a GeoGrid: AGR, ATGR and SoLV Explained
One scan, twenty-five answers to the same question: where do you rank from here? This is how to read the map, and the three numbers that sum it up.
Key takeaways
- A GeoGrid checks your Google Maps rank for one search from many points across an area, because rank changes with where the searcher is standing.
- AGR averages your rank where you appear in the top 20. ATGR averages every point, counting the ones where you don't appear as 21.
- SoLV is the share of points where you rank first, second or third.
- Read the three together. A good AGR with a poor ATGR means you rank well in a small area and not at all beyond it.
Ask a plumber where they rank on Google and you will usually get one number. "We're third for emergency plumber." It is a fair answer to an unfair question, because there is no single rank. Google orders local results partly by how close each business is to the person searching, so the same search gives a different list a mile down the road.
A GeoGrid is the tool for seeing that. This guide walks through one example grid from top to bottom: what the colors mean, how the three summary numbers are worked out, and what to do with what you find.
What a GeoGrid actually shows
A GeoGrid lays a square grid of points over a map, centered on a business. At each point it asks the same question: if someone searched for this keyword from here, where would this business appear in Google Maps? The answer is written on the point and the point is colored to match.
In Local Optics a grid can be 3 by 3, 5 by 5, 7 by 7, 9 by 9 or 13 by 13 points, with the points spaced anywhere from 100 meters to 25 kilometers apart. A tight grid suits a locksmith in a dense downtown. A wide one suits an HVAC company that drives forty minutes to a job.
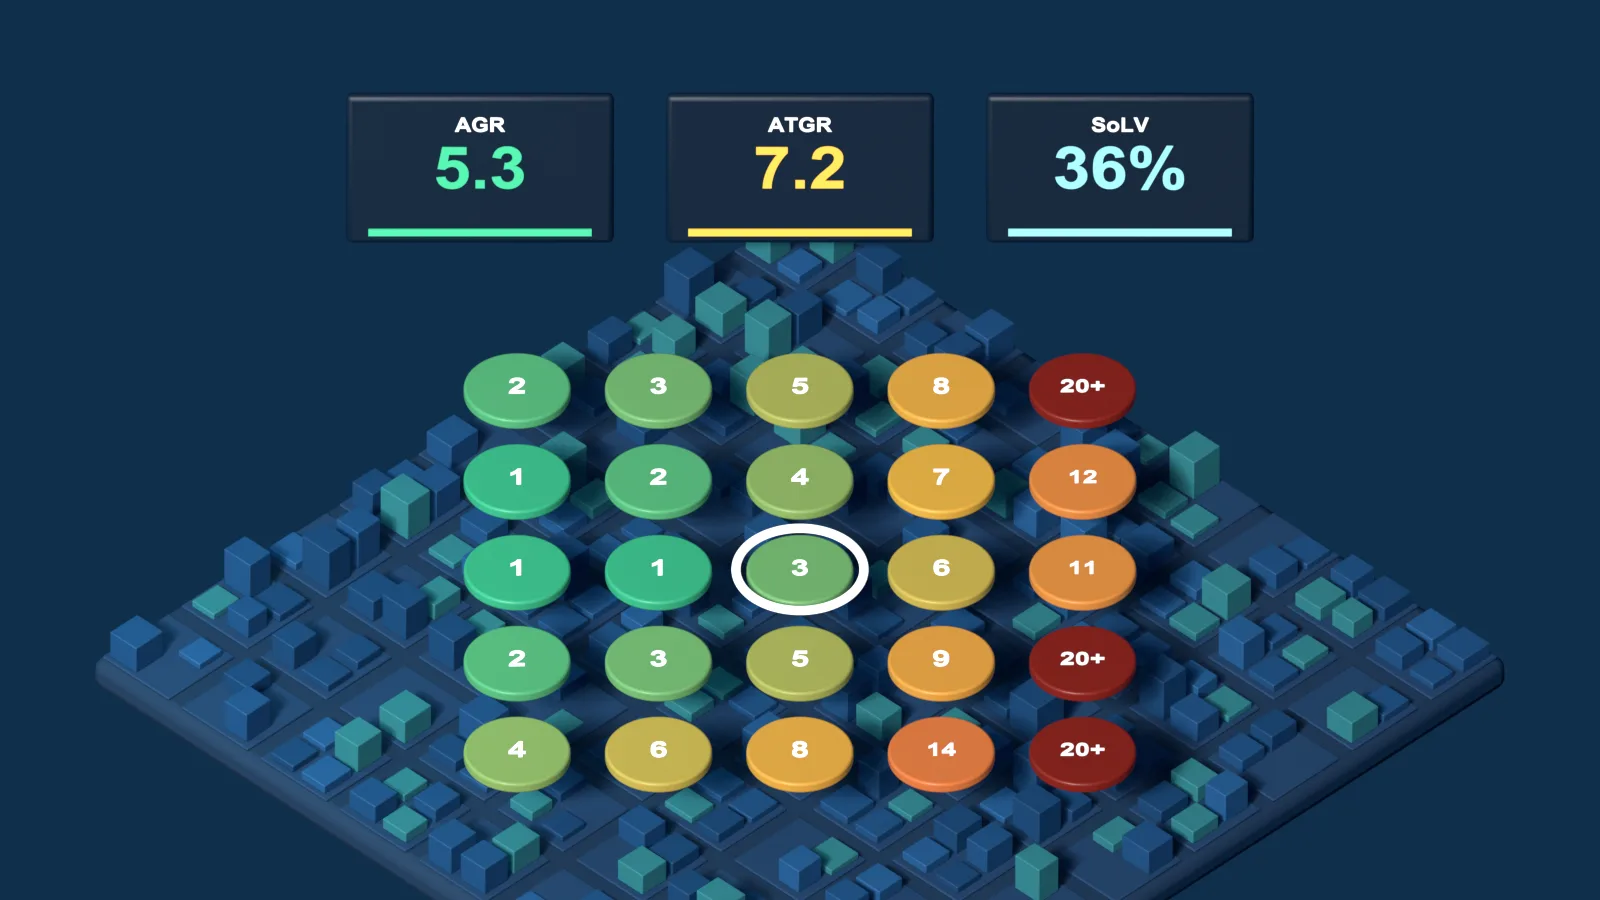
Our example is a 5 by 5 grid, so 25 points, for a single keyword:
Reading the colors
The colors run on a scale. Rank 1 is green, and each step down shifts the color toward amber and then red at rank 20. A point where the business is not among the first 20 results is dark red and marked 20+.
Before you look at any numbers, look at the shape. In the example the left-hand side is green and the right-hand side fades through amber to dark red. That is a business that is strong to the west and all but invisible on the eastern edge. No average will tell you that; the picture does in a second.
AGR: Average Grid Rank
AGR is the average of your rank across the points where you appear in the top 20. Points marked 20+ are left out.
In the example, 22 of the 25 points have a rank, and those ranks add up to 117.
AGR answers: where I show up, how well do I show up? It is the kindest of the three numbers, because it says nothing about the places you don't show up at all.
ATGR: Average Total Grid Rank
ATGR averages every point on the grid. A point where you are outside the top 20 is counted as 21.
The 22 ranked points still add up to 117. The three misses add 63, for a total of 180.
ATGR answers: across the whole area I care about, how visible am I? It is always equal to or worse than AGR, and the gap between them is worth watching. Here the gap is about two places, caused entirely by the eastern edge.
SoLV: Share of Local Voice
SoLV is the percentage of grid points where you rank first, second or third. Those are the positions that matter most, because the top three local results are the ones Google shows most prominently.
SoLV answers: in how much of this area am I one of the first names a customer sees? Of the three numbers it is the closest to what a customer experiences.
Reading the three numbers together
Each number hides something the others reveal. The pattern across all three tells you what kind of problem you have.
| What you see | What it usually means |
|---|---|
| Good AGR, much worse ATGR | You rank well close in and vanish further out. The grid may be wider than your real reach, or there is an area you have no presence in. |
| AGR and ATGR close together, low SoLV | You appear nearly everywhere but rarely in the top three. You are in the running across the area and not yet winning it. |
| High SoLV, poor ATGR | You dominate one pocket. Strong at home, unknown elsewhere. |
| All three improving | Your reach and your position are both growing. Keep doing what you are doing. |
Our example, with an AGR of 5.3, an ATGR of 7.2 and a SoLV of 36%, is the first pattern with a twist: the weakness is not all around the edge, it is one side. That is a more useful finding than any of the three numbers on its own.
What to do with a weak area
A grid tells you where to look. It does not tell you why. For the dark red column on the right of the example, these are the questions to ask, in order.
- Who ranks there instead? Each point records the top 20 businesses, so you can open any competitor from the same scan and see their grid. If one competitor is green exactly where you are red, you have found who you are up against.
- Is it a place you actually serve? If the weak area is beyond where your crews go, the grid is too wide. Tighten the spacing or switch off the points you don't care about.
- Is the keyword right? A grid is for one search. "AC repair" and "HVAC contractor" can produce very different maps for the same business.
- What evidence of your work exists there? If you do jobs in that area, make them visible. Job site check-ins publish finished jobs to your website and Google profile with the neighborhood they were done in.
Four common mistakes
- Comparing scans with different settings. Change the grid size, the spacing or the center and the numbers are no longer comparable. Keep the settings fixed and let only time change.
- Reading one scan as the truth. Local results shift from week to week. Schedule the same scan weekly or monthly and judge the trend.
- Watching only one number. An AGR that improves while ATGR stands still means you gained places where you were already visible, and nothing new.
- Tracking only your best keyword. The search you already win is the least informative. Track the ones you want to win.
Common questions
What is a good AGR?
There is no universal figure, because it depends on how wide the grid is and how competitive the search is. As a rule of thumb, an AGR of 3 or better means that where you appear, you appear in the top three on average. Compare your own scans over time, with the same settings, before you compare yourself with anyone else.
Why is my ATGR worse than my AGR?
Because ATGR counts the points where you are outside the top 20 as 21, and AGR leaves them out. The two are only equal when you rank in the top 20 at every point on the grid.
How big should my grid be?
Big enough to cover the area you want customers from, and no bigger. Start with a 5 by 5 or 7 by 7 grid that reaches the edge of your service area. If the outer ring is all dark red, either the grid is too wide or that is exactly where you need to grow.
How often should I run a scan?
Monthly is enough to see a trend, and weekly is useful while you are actively working on a location. In Local Optics, scans can be scheduled weekly, every two weeks, monthly or quarterly.